
Direct mail ROI depends on what the campaign adds after costs. Use a consistent definition of profit and compare the mailed audience with an appropriate baseline. Broad channel averages cannot tell you whether your mailing will pay back.
The practical difficulty is separating a response that followed a mailing from a response caused by it. Start with the cost ledger and measurement plan before ordering cards.
This post explains campaign cost, response attribution and incremental contribution, with a worked example you can adapt to your own assumptions.
How to Calculate Direct Mail ROI
For profit-based ROI, subtract campaign cost from incremental contribution, then divide by campaign cost. Contribution means revenue left after the variable costs of fulfilling the additional sales, before subtracting the mailing cost.
Direct mail ROI = ((Incremental contribution from campaign - Campaign cost) / Campaign cost) × 100.
Illustrative calculation: a $5,000 campaign produces $22,500 in attributable revenue. Revenue divided by campaign spend is 4.5:1. If all that revenue is incremental and its contribution margin is 40%, contribution is $9,000 and profit-based ROI is ($9,000 - $5,000) / $5,000 = 80%. Those are assumptions, not a forecast.
The cost-per-piece calculation should include: design and copywriting, print and production, postage, list acquisition or CRM pull time, and any tracking setup (unique URLs, QR codes, promo codes). For more data on what these numbers look like across campaigns, see our roundup of direct mail statistics.
Attribution Methods for Direct Mail
Unique URLs and QR Codes
Assign a landing page URL or QR destination to the campaign. Visits show engagement with that link, but the link can be shared and a visit does not prove that the mailing caused a purchase. Use the signal alongside campaign records.
Use vanity URLs that are easy to type (yourbrand.com/spring2026) rather than UTM-tagged URLs that are unreadable in print. The QR code can carry the full UTM string invisibly.
Unique Promo Codes
A campaign-specific promo code can help identify orders associated with an offer. Codes can be shared, and some recipients may order without one; code attribution is not a complete measurement of incremental impact.
If you offer a discount, include its cost in the margin calculation and compare it with the same offer in the comparison group. A higher response rate can still leave less profit.
Phone Tracking Numbers
For campaigns that drive phone responses, assign a unique phone number per campaign using a call tracking service. Every inbound call to that number is attributed to the direct mail piece.
Matched Mail/No-Mail Control Groups
When practical, randomly assign comparable accounts to mailed and unmailed groups before sending. Define the outcome and observation window in advance. The difference estimates incremental impact, with uncertainty; prevent one account from appearing in both groups.
Small tests can produce a wide range of plausible effects. Choose the sample size around the decision you need to make and the expected outcome frequency. A handful of responses is useful learning but rarely precise evidence.
A comparison group can reveal whether additional purchases justify the mailing. It can also show no clear effect or a loss. Record all three possibilities when planning the test.
Direct Mail ROI Benchmarks
By Channel
Direct mail: include production, postage, list preparation, staff time and tracking costs.
Email: include software, list work, creative production and the margin cost of any offer.
Paid social: distinguish attributed revenue from incremental profit and include creative costs.
Paid search: keep branded and nonbranded traffic separate when comparing acquisition costs.
To assess adding mail to digital activity, keep the existing digital program the same in both test groups. Then measure what the additional mailing changes.
By Response Rate
Generic mail: measure the actual reply or purchase rate for the audience and offer.
Personalized mail: include the time needed to prepare and check variable fields.
Triggered mail: record the event, exclusion rules and timing used to select recipients.
Handwritten mail: use your own campaign results; no verified Scribble client response-rate benchmark is supplied here.
Response rate is not the same as ROI. A 15% response rate from 100 pieces to a high-value segment can outperform a 4% response rate from 10,000 pieces to a cold list. Match the format to the audience value. For more on how personalization moves these numbers, see our guide to personalized direct mail.
By Campaign Type
Cold prospect acquisition: distinguish a reply, a qualified lead, a booked meeting and a sale.
Win-back campaigns: define when a customer counts as lapsed and exclude recent purchasers.
Retention campaigns: choose a renewal or repeat-purchase window that fits the business.
Post-purchase follow-up: measure later contribution after returns and discounts, not just order count.
How to Compare Handwritten and Standard Direct Mail
A handwritten card may suit a personal follow-up, but physical open rates are not measured by Scribble. Do not assign a 99% open rate or infer a sale from a mailed status.
The recipient may read, save, ignore or discard either format. A test of the same message and audience is more useful than assuming how each person handles mail.
No verified customer dataset supports the earlier 15–25% Scribble response-rate claim. Set your model from explicit assumptions or your own comparable campaign history.
Choose a format that fits the audience, message and budget. Compare providers using current quotes and physical samples, then measure the result of a small mailing. Further reading: handwritten card services.
Building a Direct Mail ROI Model Before You Send
Before launching a campaign, build a simple model with these inputs:
List size: how many pieces are you sending?
Cost per piece (all-in): design, print, postage, handwriting if applicable
Assumed response rate: use a range from your own history or clearly labeled test assumptions.
Contribution per additional sale: account for fulfillment costs, refunds and the time horizon.
Conversion rate from response to revenue: not every response closes
Illustrative model: 200 pieces × $8 = $1,600 campaign cost. Assume 5% respond and 40% of those responses become incremental sales: 4 sales. At $2,000 revenue and 40% contribution margin per sale, contribution is $3,200. Profit-based ROI is ($3,200 - $1,600) / $1,600 = 100%.
Run low, middle and high assumptions, including a no-lift outcome. If a loss would exceed your test budget, reduce the mailing or improve the plan before sending. Further reading: direct mail campaign tips.
Common ROI Measurement Mistakes
Choosing an Observation Window That Fits the Sale
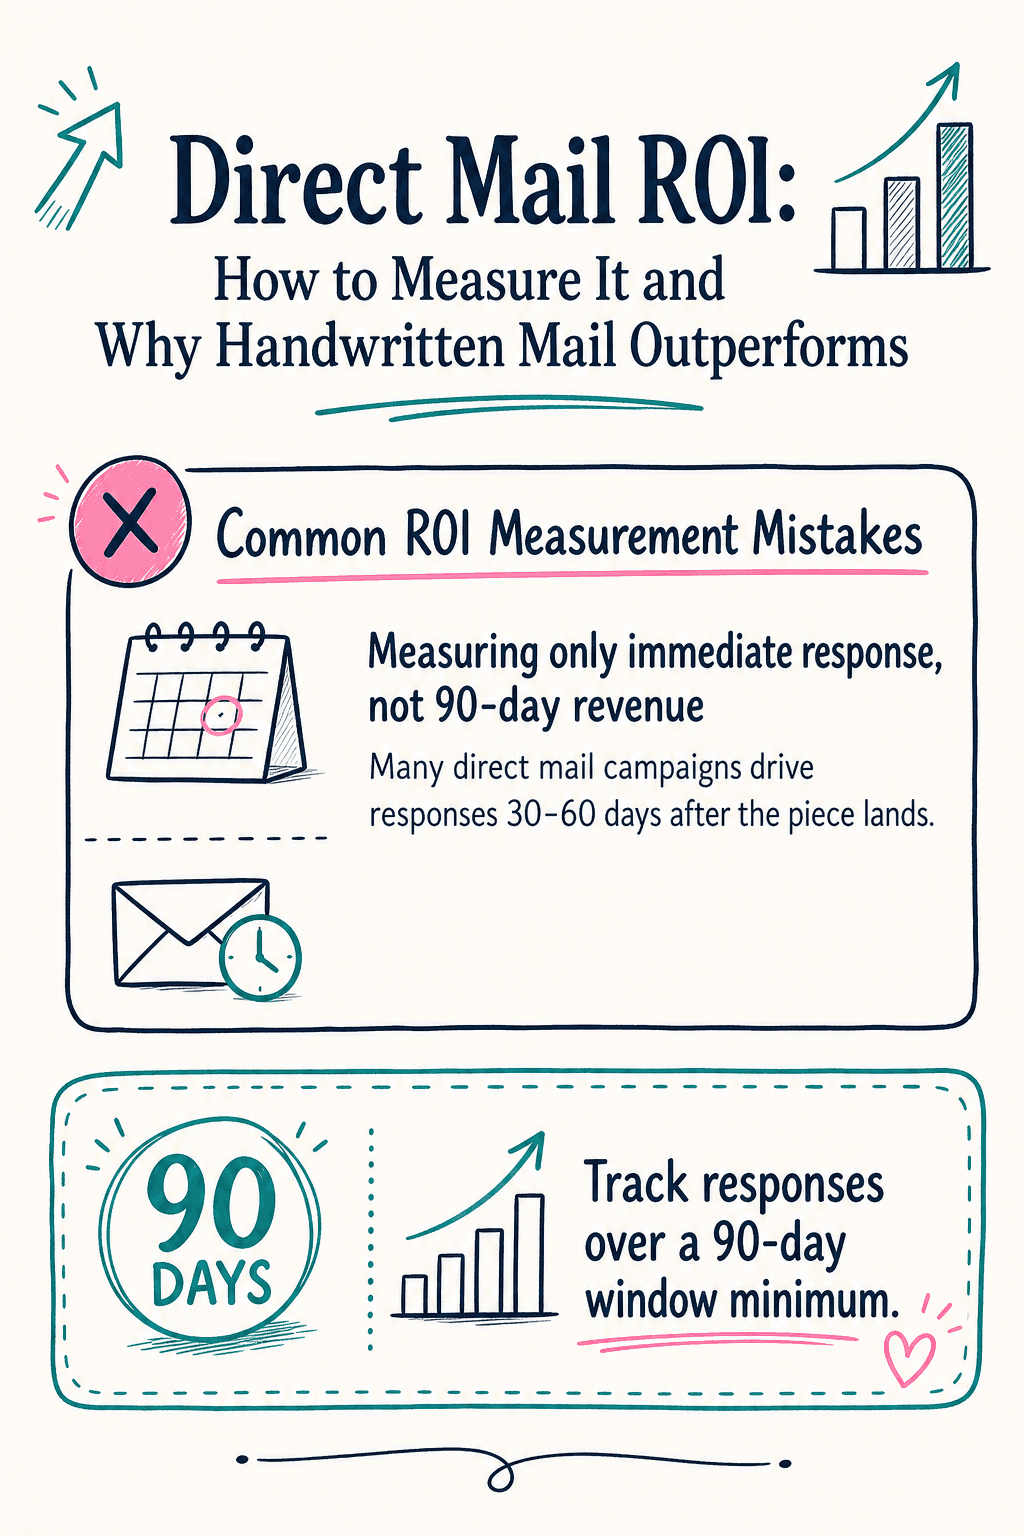
Choose an observation window that fits the purchase cycle before sending. Ninety days is one possible window, not a universal minimum. Report late outcomes separately if the measurement plan changes.
Not accounting for multi-touch attribution
A prospect who received a direct mail piece, then clicked a retargeted ad, then converted via search should not have 100% of the revenue attributed to search. Agree a multi-touch attribution model before the campaign runs, not after.
Comparing direct mail cost-per-click to digital
Cost per click answers a different question from cost per customer. Compare channels using the same outcome and cost definition; a QR visit, qualified reply and sale should be separate measures.
Frequently Asked Questions
What is a good ROI for direct mail?
A useful target depends on your margin, cash constraints, payback window and uncertainty. There is no universal good ROI. Include all campaign costs and assess whether the measured incremental contribution covers them.
How do you calculate direct mail ROI?
ROI = ((Incremental contribution - Campaign cost) / Campaign cost) × 100. Define the observation window and comparison group before sending. Report revenue per dollar of spend separately from profit-based ROI.
Is direct mail ROI higher than email?
Neither channel has an automatic ROI advantage. Compare the same outcome, audience and cost basis. Test what mail adds while keeping the email activity comparable.
How long does it take to see ROI from a direct mail campaign?
Use the buying or renewal cycle to choose a measurement window. A quick reply and a contract renewal may occur months apart. Allow for preparation and transit before starting any follow-up that assumes a card has arrived.
Does handwritten mail really have better ROI than printed direct mail?
It can, but the format does not guarantee higher ROI. A more expensive card needs enough additional contribution to cover the cost difference. Test the formats with comparable audiences and messages.
The Bottom Line
You can measure a mailing by recording costs, outcomes and a comparison group. The result may justify another test, a larger campaign or stopping the program.
Choose the measurement window and a spending limit before the first send. Keep attributable revenue and estimated incremental profit separate in the report.
Plan a small Scribble mailing, record its full cost and measure replies and later outcomes in your own CRM. Further reading: Scribble.