
A recipient can scan a card and buy something they already intended to buy. Another recipient can read the card, return to your website directly, and leave no scan behind. A campaign report needs room for both possibilities.
This worksheet helps a campaign owner plan a small experiment before the mailing list goes to production. It includes a fictional result set so the calculations are visible. The numbers are teaching inputs, not a response-rate benchmark or a promise about Scribble.
Write the decision before selecting recipients
Start with the decision that the result will change. “Should we add an appreciation card to this customer program next quarter?” is specific enough to guide a test. “Does direct mail work?” leaves the audience, message, timing, and desired behavior undefined.
Choose one primary outcome that your systems can observe for both groups. For a repeat-purchase test, that might be at least one completed, nonrefunded order within the observation window. For account outreach, it might be a qualified meeting held. Define who qualifies and how duplicate outcomes are handled before anyone sees the results.
- Record the audience rule and its export date. Save the count before assignment.
- Name the owner of the outcome report and the system of record.
- Choose the observation window, analysis date, and budget decision in advance.
- List other campaigns that will continue for both groups. Record any unavoidable differences.
NIST’s design guidance starts with the experimental objective and the factors under investigation. Applied here, that means keeping the question narrow enough to interpret. Testing a new audience, a new offer, a new sales sequence, and a card together measures a package of changes. [1]
Assign a holdout you can actually preserve
Create the eligible list first. Remove duplicate records, ineligible addresses, and contacts whose preferences exclude the mailing before assignment. Randomly assign the remaining units to the mailed or no-mail group, then save that assignment as fixed values. Sorting by recent spend or taking the first half of a sales rep’s list is a different selection process.
A completely randomized design assigns the treatment to experimental units randomly. For this worksheet, the treatment is the additional card. The important practical choice is the unit: one person, one household, or one business account. Use a unit that matches how the outcome is recorded and how people might share the message. [2]
For example, if four contacts at one account can influence a single renewal, putting two contacts in each group creates a muddled comparison. Assign the account together and analyze account outcomes. An account-level design also changes the sample-size and analysis problem; the simple person-count calculator below does not solve that problem for you.
After assignment, suppress holdout members from the tested mailing and any manual resend of it. Keep required service communications and normal support available. A test should never depend on withholding an essential notice, promised response, or remedy.
Keep the outcome window and denominator consistent
Record the planned send date and the observation window for both groups. Allow for the actual fulfillment and postal process when choosing that window. The choice should reflect the buying or response cycle you are studying; there is no universal number of days that makes every mailing comparable.
Track attempted sends, accepted sends, returned mail, and observed outcomes as separate fields. A returned envelope is operational evidence. It is not permission to silently remove an assigned recipient from the main result after seeing what happened.
For the primary comparison in this worksheet, retain everyone in their originally assigned group. Report delivery problems alongside it. If you also calculate a result among apparently deliverable records, label it as a secondary view and describe how records entered that subset. Without reliable delivery evidence, “not returned” should not be renamed “delivered.”
A shared QR code can describe visits to a campaign page, but the holdout needs the same purchase or meeting definition as the mailed group. A scan-only outcome would leave the holdout with no equivalent way to qualify. Preserve the distinction in the reporting table.
- Primary outcome: the predefined business event, observable in both groups.
- Channel response: scans, replies, calls, or other signals with their own tracking limits.
- Operations: cards attempted, production exceptions, returns, and manual interventions.
Work through an illustrative result
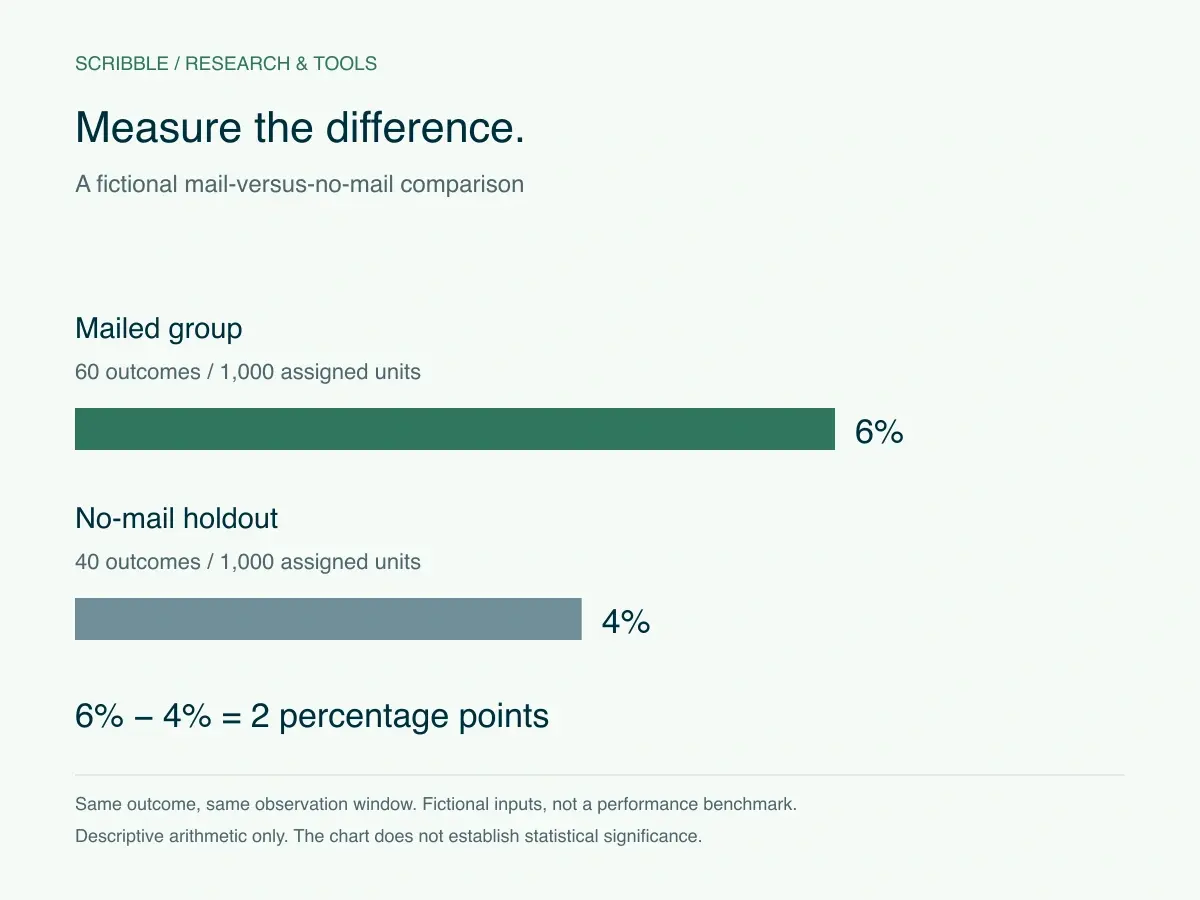
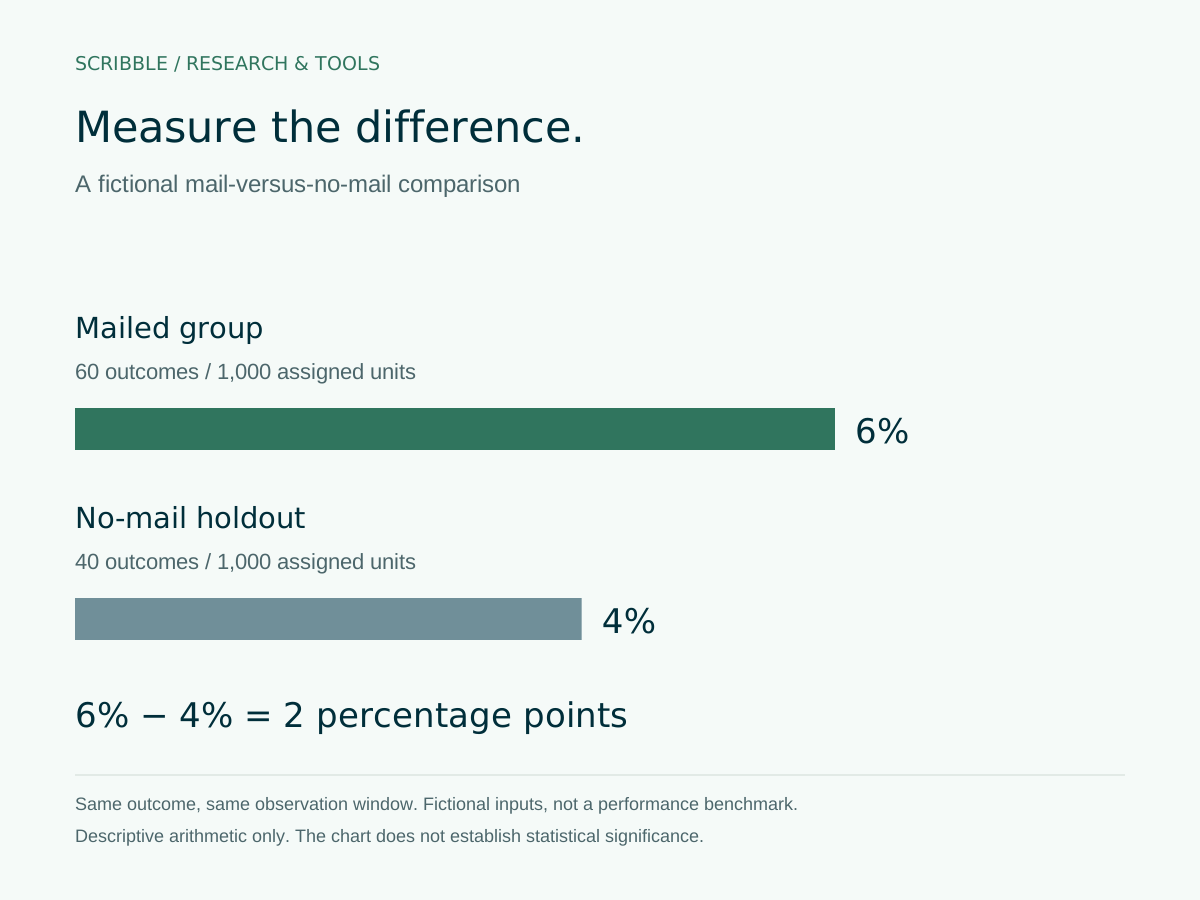
Suppose an eligible audience is randomly divided into two groups of 1,000. During the predefined window, 60 mailed recipients and 40 holdout recipients complete the primary outcome. Count each unit once, even if it places several orders.
Scroll the table horizontally if needed.
| Measure | Mailed group | No-mail holdout |
|---|---|---|
| Assigned units | 1,000 | 1,000 |
| Units with the primary outcome | 60 | 40 |
| Observed outcome rate | 6% | 4% |
The observed difference is 6% minus 4%, or 2 percentage points. Applying the 4% holdout rate to the 1,000 mailed units gives 40 expected outcomes under that comparison. The difference between 60 and 40 is an estimated 20 additional outcomes in the mailed group.
Relative lift is 2 divided by 4, or 50%. That larger-looking percentage describes the same result as the 2-point difference. Show the rates and counts beside it so the presentation does not exaggerate what happened. If the holdout rate is zero, the relative-lift percentage is undefined; the absolute difference can still be reported.
Compare your mailed and holdout groups
Enter group sizes and counts of units with the same predefined outcome. The calculator shows descriptive differences. It does not check randomization, calculate statistical significance, or establish that your sample is large enough.
These starting counts are illustrative. Use groups assigned at random before mailing, one shared response definition, the same observation window, and at most one response per person. Count everyone assigned to each group.
How this is calculated
Response rate = responders ÷ assigned group size. Difference in percentage points = mailed rate − control rate. Estimated additional responders = mailed responders − (control rate × mailed group size).
For an illustrative cost check, suppose the mailing costs $5,000 in total, or $5 per mailed card, and each additional order contributes $50 after variable order costs. Twenty additional orders would contribute $1,000 before the mailing cost, leaving a $4,000 shortfall after it. A positive response difference can still lose money. These are hypothetical inputs, not a Scribble price quote. Replace them with your complete cost and actual contribution definition; revenue alone would overstate what is available to pay for the campaign.
Read the uncertainty before making a budget decision
An observed gap can change when a different set of recipients is selected. The calculator deliberately reports arithmetic without declaring a winner. Plan the minimum improvement that would matter to your business and have the sample size and analysis method reviewed before launch if the result will support a material budget decision.
NIST describes confidence intervals for proportions and notes limitations of simple normal approximations when samples or event counts are small. Its single-proportion interval is not, by itself, an interval for the difference between these two groups. Use a method appropriate to your actual design and outcome rather than attaching an unrelated interval to the lift number. [3]
Do not stop the experiment the first afternoon that the mailed group looks ahead if the plan calls for a later analysis. Record the agreed end date and any deviations. Likewise, avoid searching dozens of tiny audience segments after the fact and presenting the strongest one as the planned result.
The practical decision has three possible directions. Continue cautiously when the evidence and economics support the next test. Revise the mailing when execution problems or an unclear offer prevented a useful read. Pause when the plausible benefit does not justify the cost. An inconclusive pilot can still identify a broken address process without proving a sales effect.
Save a report another person can audit
Keep the dated audience rule, frozen assignment file, creative version, send log, outcome definition, window, analysis code or formulas, and decision together. Store recipient-level files in your normal restricted workspace. A public write-up can use aggregate counts and a blank method template without exposing customer identities.
When you share a result internally, lead with the audience and dates. Show both group sizes, both outcome counts, the absolute rate difference, the uncertainty analysis, total cost, and the operational exceptions. Describe a change in a test as an estimate for that audience and mailing. Extending it to another season, product, or customer segment needs a reason and usually another check.
Frequently asked questions
What percentage should go into the holdout?
There is no universal percentage. Group sizes depend on the expected outcome frequency, the improvement you need to detect, the design, and your constraints. A tiny control group may make the comparison too imprecise. Choose the allocation before sending and review the sample-size plan for the decision you need to make.
Can we compare this month’s mailing with last month’s customers?
You can describe the difference, but month, audience, offers, and other activity may also differ. This worksheet is designed for a concurrent randomized comparison so the additional mailing is the planned difference. A historical comparison needs its own method and clearly stated limitations.
Should returned mail be removed from the result?
Keep assigned units in the primary comparison described here and report returns separately. A secondary operational view can be useful, but changing the main denominator after assignment can make the result hard to interpret. Document exclusions and their timing.
Does a positive result mean we should mail everyone?
Review the uncertainty, contribution after complete mailing cost, execution issues, and the population studied first. A pilot can support a bounded next step. It cannot guarantee the same result for a larger or different audience.
Sources and methodology
Reviewed .
Scribble authored this operational worksheet using the cited experimental-design references. All campaign counts, costs, and outcomes are fictional teaching inputs. The calculator performs descriptive arithmetic and does not supply a power analysis, confidence interval, or significance test.
- How do you select an experimental design?
NIST/SEMATECH e-Handbook of Statistical Methods · Accessed
General experimental-design guidance; the mailing workflow is Scribble’s practical application.
- Completely randomized designs
NIST/SEMATECH e-Handbook of Statistical Methods · Accessed
- Confidence intervals for proportions
NIST/SEMATECH e-Handbook of Statistical Methods · Accessed
Describes single-proportion intervals; not a supplied two-group lift interval.